Average PTO Days by Employer Size in the United States
Ever wondered if new employees get the same number of PTO days as those with over 10 years of service in the company? Oftentimes, they do not. Not only in the United States but employers from other countries as well provide incentives to long-term employees. One of those incentives is a gradual increase in paid vacation days as employees increase their number of years with the company. Let's dive into the fascinating world of paid vacation days and see how they stack up based on employer size and years of service!
According to the employee benefits survey reported by the U.S. Bureau of Labor Statistics (BLS) on March 2024, the average number of paid vacation days for private industry workers varies by the size of the establishment and the years of service. Here are the tables summarizing these averages according to company size:
Before we present the data on the number of average paid vacation days, we want to explain that we have grouped the years of employment into 1, 5, 10, and 20 years. This grouping helps to clearly illustrate how paid vacation days accumulate over time and highlights the incentives provided by employers to encourage long-term employment and loyalty.
Average paid vacation days for private industry workers in establishments with 1 to 99 employees
The data we will present below is particularly for private industry workers whose employer has 1-99 employees. Here we will do comparison on the average number of paid vacation days based on the number of years of employment.
| Years of Employment | Average Paid Vacation Days |
|---|---|
| After 1 year | 10 days |
| After 5 years | 14 days |
| After 10 years | 16 days |
| After 20 years | 17 days |
source: U.S. Bureau of Labor Statistics
Let's quickly discuss the data presented in the table. For private industry workers in establishments with 1 to 99 employees, the number of paid vacation days gradually increases with years of employment. Here's a breakdown of how vacation days accumulate over time, along with the percentage differences:
Average Paid Vacation Days for Small Establishments
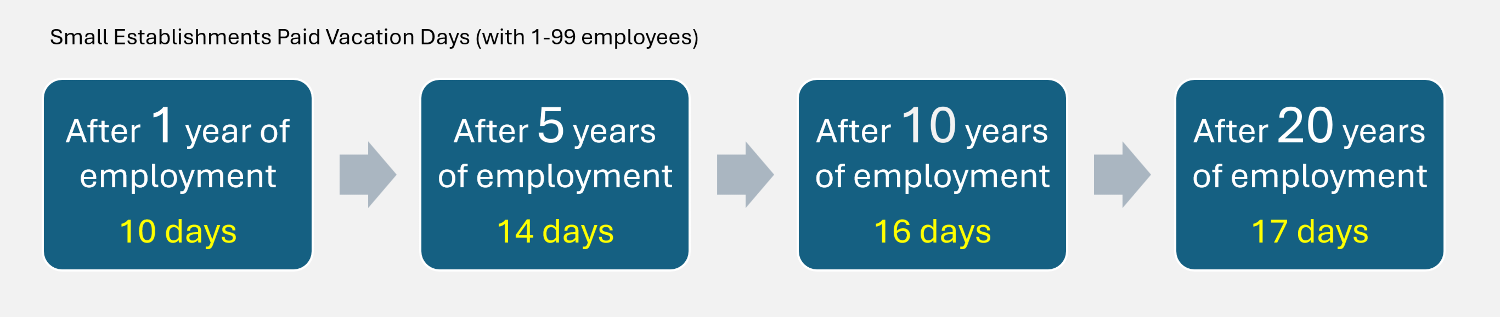
After 1 year of employment
Workers receive an average of 10 paid vacation days. This provides a solid foundation for new employees to take time off and recharge.
After 5 years of employment
The average number of paid vacation days increases to 14, which is a 40% increase from the first year. This reflects the value placed on employee loyalty and long-term commitment.
After 10 years of employment
Workers enjoy an average of 16 paid vacation days, representing a 14.29% increase from the 5-year mark. This additional time off recognizes the significant contributions of experienced employees.
After 20 years of employment
The average number of paid vacation days reaches 17, a 6.25% increase from the 10-year mark. This slight increase rewards the dedication and long-term service of veteran employees.
Overall, private industry workers in smaller establishments see a gradual increase in paid vacation days as they gain more years of service, highlighting the importance of employee retention and satisfaction. For smaller establishments, the PTO offerings may be less generous due to budget constraints and limited resources. These companies often rely heavily on each employee, making it harder to provide extensive time off without disrupting operations. However, smaller companies may offer other flexible work arrangements or benefits to compensate for fewer PTO days.
Average paid vacation days for private industry workers in establishments with 500 or more employees
The table below shows the average number of paid vacation days that employees in the private sector can gain if they work in an organization with 500 or more employees. We will determine how each milestone (1, 5, 10, and 20 years) of service in the company differs in terms of the number of PTO days they get.
| Years of Employment | Average Paid Vacation Days |
|---|---|
| After 1 year | 14 days |
| After 5 years | 18 days |
| After 10 years | 21 days |
| After 20 years | 24 days |
source: U.S. Bureau of Labor Statistics
Let's dive into the data presented in the table and uncover some interesting insights. For private industry workers in establishments with 500 or more employees, the number of paid vacation days increases with years of employment, just like that of the employers with 1-99 employees we discussed earlier. Here's a breakdown of how vacation days accumulate over time, along with the percentage differences:
Average Paid Vacation Days for Large Establishments
Let's get into the breakdown of the average number of paid vacation days for large establishments (with 500+ employees):
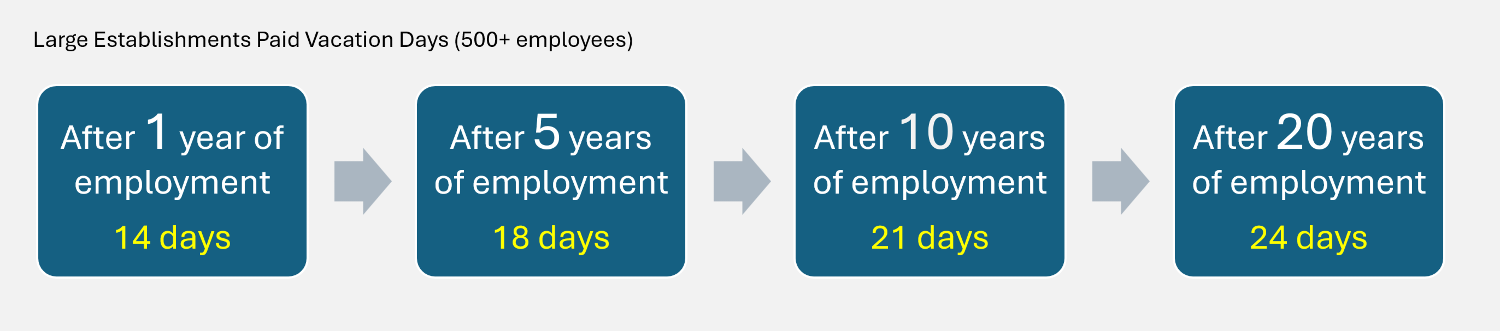
After 1 year of employment
Workers receive an average of 14 paid vacation days. This provides a generous amount of time off for new employees to take a break and recharge.
After 5 years of employment
The average number of paid vacation days increases to 18, which is a 28.57% increase from the first year. This reflects the value placed on employee loyalty and long-term commitment.
After 10 years of employment
Workers enjoy an average of 21 paid vacation days, representing a 16.67% increase from the 5-year mark. This additional time off recognizes the significant contributions of experienced employees.
After 20 years of employment
The average number of paid vacation days reaches 24, a 14.29% increase from the 10-year mark. This increase rewards the dedication and long-term service of veteran employees.
Overall, private industry workers in larger establishments see a steady increase in paid vacation days as they gain more years of service, highlighting the importance of employee retention and satisfaction. Larger employers typically have more robust PTO policies, reflecting their greater resources and ability to manage employee absences without significantly impacting operations. These companies often compete to attract and retain top talent, thereby offering more generous vacation benefits. Additionally, larger organizations may have more formalized HR policies and procedures that ensure employees are aware of and can take advantage of their PTO benefits.
Takeaway for Employees and Employers
For employees, it's always a great practice to appreciate the PTO days provided by your employer and use your vacation days as an opportunity to recharge. Taking time off can help you return to work more rested and productive, ultimately benefiting both your personal well-being and your professional performance. Avoid burnout by making use of your well-deserved PTO.
As for employers, offering incentives such as increased PTO days at key milestones can significantly enhance employee satisfaction and retention. Design your PTO policies based on the demands of your work environment to ensure they are both attractive to employees and sustainable for your business operations. Additionally, employees appreciate an organization that values their length of stay in the company. Designing a PTO policy that motivates employees to stay long-term can result in great savings for you, as it reduces the money spent on recruitment and training.
Next Recommended Read: Average PTO Based on Industry Size
This page has shown us the average paid vacation days for small and large businesses, factoring in the years of employment. If you're curious about how many PTO days an employee gets based on the industry they work in, you're in for more fascinating insights. Do healthcare workers get more PTO than IT workers? Do workers in leisure and hospitality gain more PTO than those in education services? You will get your answers in this next recommended read. Different industries have unique PTO policies that can significantly impact your work-life balance and overall job satisfaction. To explore this topic further and discover how PTO varies across different sectors, feel free to visit our detailed guide on Average PTO Days by Industry in the United States. Dive in to see how your industry compares and gain a deeper understanding of the benefits you can expect!